A data driven campus map visualizing a single walk through anxiety and tranquility, captured through heart rate, spatial cues, and emotional landmarks. The project blends cartography and emotion to reveal how environments quietly shape human experience.

In this project, I took an active role in the design process, focusing on observation, understanding, documentation, and reflection on both physical and emotional experiences. I started by choosing two buildings on campus that were far apart and mapped out a route I rarely took in my daily routine. Along the way, I identified two powerful personal experiences that I wanted to express visually.To bring my idea to life, I used Adobe Illustrator to create a detailed, to-scale map of a specific area on campus, using Google Maps as a reference. This map became the foundation of my project. On top of it, I layered visual representations of two emotions that often shape my experiences—anxiety and tranquility.


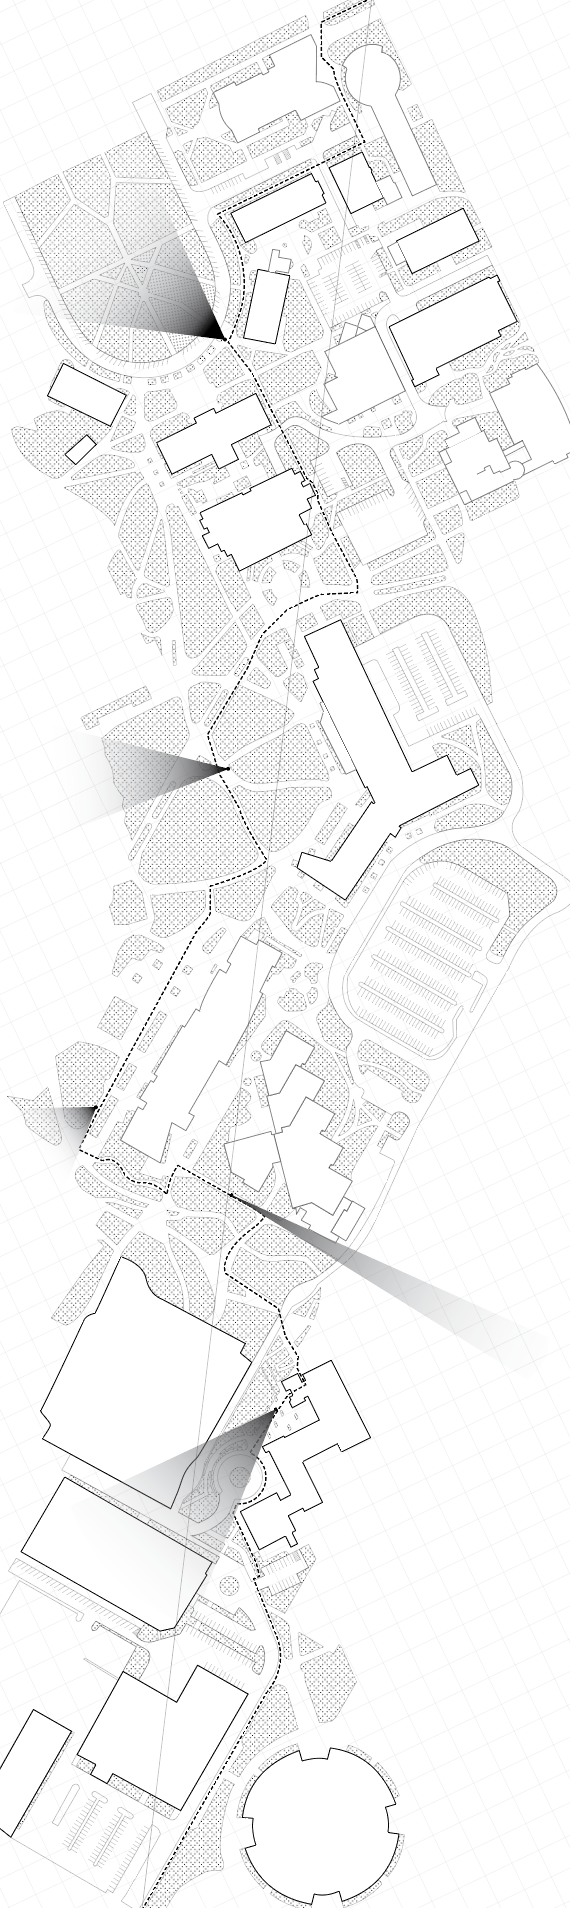
The red markings on the map indicate the locations where I experienced anxiety. The lines correspond to fluctuations in my heart rate during these moments. My resting heart rate is usually around 58 beats per minute, but as my anxiety heightened, the red lines grew larger, reflecting an increase to an average of about 75 beats per minute.
The blue circles on the map represent moments of tranquility during my walk. Alongside anxiety, I also experienced a distinct sense of calm, particularly in green spaces. Each blue circle covers a 30-foot radius from its center, gradually fading as it nears the edge of the green space, symbolizing the gradual decline of tranquility as I moved away from those areas.
The gray cones on the map indicate key vantage points and focal areas that captured my attention in these locations. They often mark the "end" of my line of sight, whether it be the farthest visible building or other significant landmarks. The width of each cone is based on measurements taken from a 20-foot vantage point at each location.


The final map captures all the experiences I had along the way. It includes a dotted line showing the exact path I took and a straight line cutting across the route for context. I designed the entire map to a 1:60 scale to keep it accurate and to scale.